
Graphical representation of motion helps students visualise distance, velocity, and acceleration using simple graphs. This article explains motion through distance-time and velocity-time diagrams that make learning physics easier.
What is Graphical Representation of Motion?
Graphical representation of motion refers to the use of graphs to describe how an object moves over time. Instead of only using equations or long explanations, scientists use graphs to visualise changes in distance, displacement, speed, and velocity. Understanding graphical representation of motion helps students interpret movement patterns quickly and clearly.
Graphs make complex ideas easier because they show relationships between physical quantities in a visual form. For example, a distance-time graph shows how far an object travels over time, while a velocity-time graph shows how velocity changes during movement.
👉 Back to: Complete Guide to Motion in Physics.
Types of Motion Graphs
There are several important graphs used to represent motion in physics:
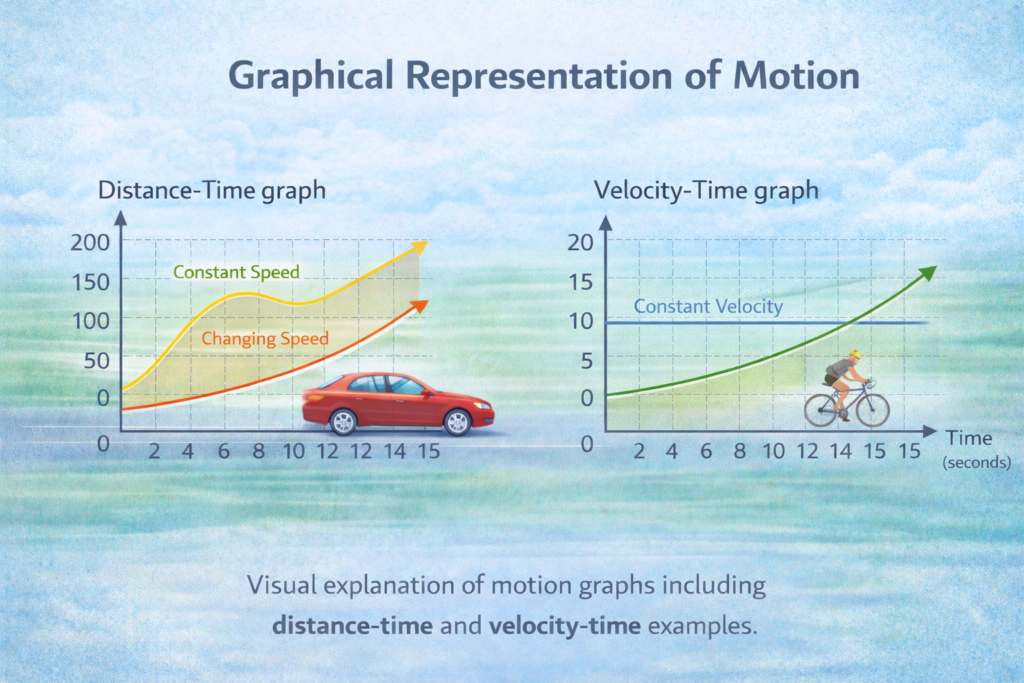
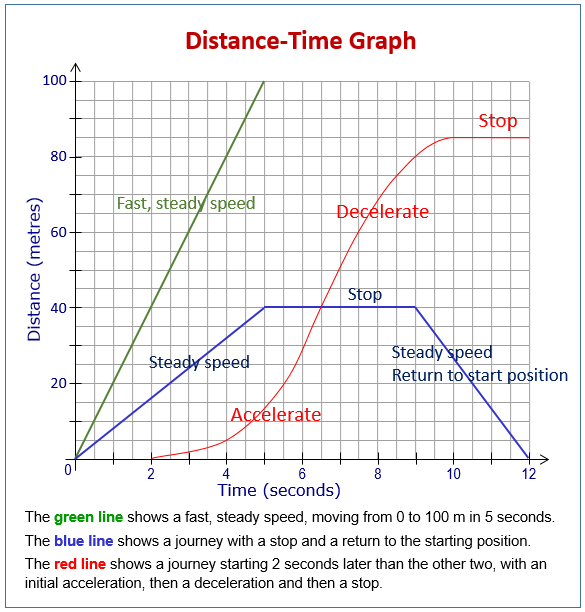
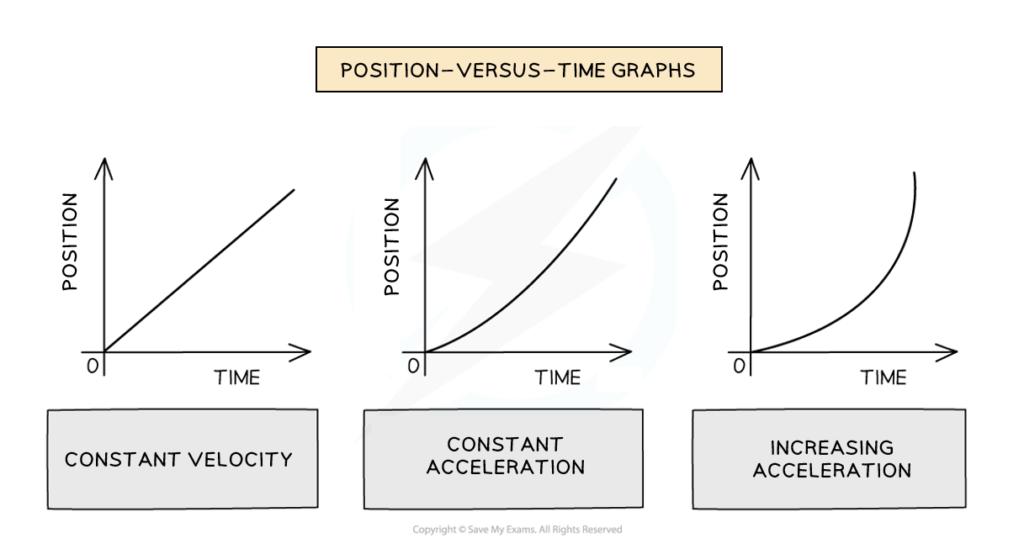
Distance-Time Graph
A distance-time graph shows how distance changes with time. In this graph:
- A straight line indicates constant speed.
- A curved line indicates changing speed.
Students use this graph to understand uniform and non-uniform motion easily.
Velocity-Time Graph
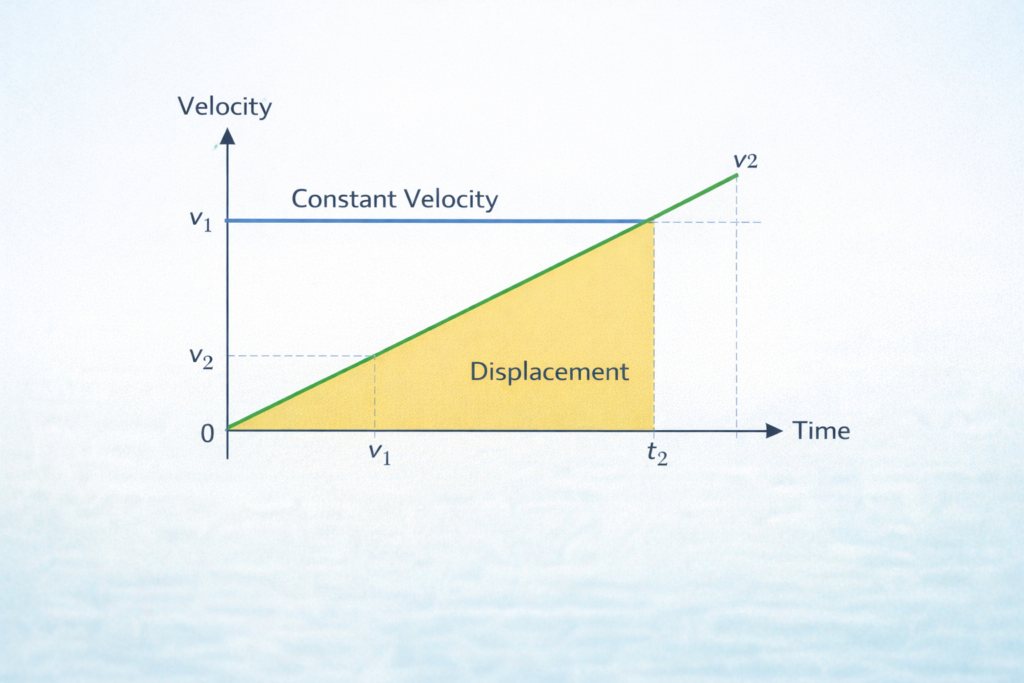
A velocity-time graph shows how velocity changes over time. This graph helps identify acceleration:
- A horizontal line represents constant velocity.
- A sloping line indicates acceleration.
- The area under the graph represents displacement.
Learning these graphs helps students analyse motion more effectively.
Importance of Graphical Representation
Graphs are powerful tools because they simplify large amounts of data. Instead of reading long descriptions, students can quickly understand motion by looking at lines, slopes, and curves.
Graphical representation of motion is important because it helps:
- Compare different types of movement
- Identify uniform and non-uniform motion
- Analyse acceleration visually
- Solve numerical problems more easily
Many physics exams include graph-based questions, so mastering this skill is essential.
Understanding Slope in Motion Graphs
The slope of a graph provides valuable information about motion:
- In a distance-time graph, the slope represents speed.
- In a velocity-time graph, the slope represents acceleration.
A steeper slope usually indicates faster movement or higher acceleration. Understanding slope helps students interpret graphs accurately without complex calculations.
Real-Life Examples of Motion Graphs
Graphical representation is used in many real-world situations:
- GPS systems tracking vehicle movement
- Sports analysis measuring athlete performance
- Scientific experiments studying motion patterns
These applications show how graphs help scientists and engineers understand movement more efficiently.
Common Mistakes Students Make
While learning graphical representation of motion, beginners often:
- Confuse distance-time graphs with velocity-time graphs
- Forget to label axes properly
- Assume all straight lines represent the same type of motion
Avoiding these mistakes improves graph interpretation skills.
Tips for Reading Motion Graphs
Students can improve their understanding by following simple tips:
- Always check the axis labels first.
- Observe whether the line is straight or curved.
- Look at the slope to determine speed or acceleration.
Practicing graph reading regularly helps build confidence and makes physics easier to understand.
Conclusion
Graphical representation of motion helps students visualise movement using distance-time and velocity-time graphs. By understanding slopes, curves, and real-life applications, learners can analyse motion more effectively. Mastering motion graphs builds a strong foundation for advanced physics topics such as equations of motion and acceleration.
FAQs About Graphical Representation of Motion
1. What is graphical representation of motion?
It is the use of graphs to describe how distance, velocity, or displacement changes over time.
2. What does the slope of a distance-time graph represent?
It represents the speed of the object.
3. What does the slope of a velocity-time graph represent?
It represents acceleration.
4. Why are motion graphs important?
They make it easier to understand movement visually and analyse patterns quickly.
🌐 Connect With Us
👉 Informosio Official – General updates, current affairs, and informative content
👉 Continue your physics journey with our expert guides — visit our official website to explore more motion topics and student-friendly lessons.